Blackstone Group LP (NASDAQ: BX) is an investment management company, and one of the best in the business. The company invests on behalf of more than 50 percent of all pensioners in the United States.
In the past year, investors put in another $52 billion with Blackstone Group. At the end of the second quarter in the 2014 fiscal year, the company’s total Assets Under Management (AUM) reached a record high of $278 billion, which is an increase of 21 percent year over year. This feat is extremely difficult and impressive for a company of this size to achieve.
Over the second quarter the company posted an economic net income of $1.3 billion, or $1.15 per unit. This is an 89 percent increase year over year. The company’s GAAP income was reported to be $517 million for this quarter. The distributable earnings that the company posted more than doubled to $770.8 million in the second quarter year over year. This figure was up 128 percent from the second quarter of the 2013 fiscal year number of $338.5. This means that the total to date to $1.06 a unit. Blackstone Group reported that its distributable earnings to be $0.65 per common unit, which significantly increased from $0.28 the previous year. The company’s total revenue was $2.24 billion this quarter, compared to $1.43 billion in the second quarter a year earlier.
Blackstone Group boasts its claim as the most profitable asset manager in the world. Given the following charts of the company’s performance, it’s not hard to believe.
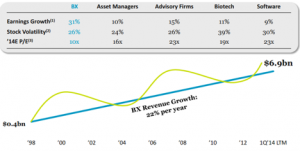
In the chart below, we can see BX’s long term statistics growth for Earnings Growth and Revenue Growth.
It is difficult to compete against the company’s 31 percent per year earnings growth and its 22 percent per year revenue growth, especially given the size of the company’s assets under management.
In addition to its recent growth, Blackstone Group is highlighting its potential for future growth as well. For example, the company increased assets under management by 21 percent year over year this quarter. The company also presented a hypothetical growth chart for AUM to show investors how the company might grow in the future.
Below is also a chart that shows the hypothetical growth of Distributable Earnings for the next ten years. The LTM on the left most bar stands for Last Twelve Months
The two of these charts both seem somewhat conservative, and Blackstone Group is confident they can achieve this goal.
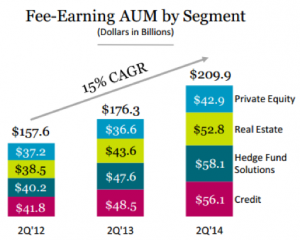
This chart below shows the company’s recent fee earning assets under management, which further corroborates Blackstone’s bright future. The values are measured in billions.
Given all the charts, statistics, and information above, it is no surprise that analysts mark Blackstone Group as a terrific investment for the long term – perhaps five to ten years. However, short term investors should be aware of the following things:
- For the last six months, approximately 4,500,000 net shares have been sold in that period of time. This means that the amount of stock that is held by insiders decreased 25.7 percent in just half a year.
- GIC Pte, a firm that manages over $100 billion of Singapore’s reserves, reported a yearly return of 4.1%. The firm cautioned that today’s high prices in the markets suggest a challenging future. Blackstone Group may experience similar challenges.
- The funds that BX manages must go through investment periods, then harvesting periods. These cycles could take up to five years. Considering the company’s outstanding performance, we may just simply be seeing the high points of one of those periods right now. For example, if you invested your money five years ago in 2009, the capital would have probably grown significantly. However, if you invested your money now, your harvesting profits may not be that great.
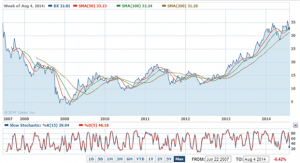
In the following chart, we can see how Blackstone Group’s stock fared in the latest economic downturn over the past eight years. Any logical investor should expect the stock to repeat its past performance.
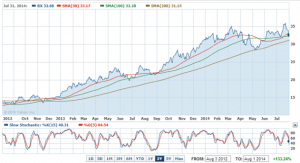
The following is a two year chart that gives a more accurate idea of the company’s recent performance.
The slow randomly distributed chart at the bottom is neither oversold nor overbought. While the main chart shows an weakening growth, it is difficult to believe that the upward trend will falter much in the near future.
The company’s second quarter earnings were outstanding – meaning that Blackstone Group should still be considered a Buy.


Pingback: Blackstone Group Lp – Wallpaper Site
Pingback: 3warranty
Pingback: 1gracefulness
Pingback: แหล่งข้อมูลบริษัทแม่ AESexy
Pingback: https://www.postandcourier.com/sponsored/phenq-reviews-does-this-diet-pill-actually-work/article_1cdbfb1a-395f-11ee-9d97-33c51303c959.html
Pingback: kojic acid soap
Pingback: lotto77
Pingback: here
Pingback: trang chủ go88
Pingback: Bilad Alrafidain
Pingback: John Lobb
Pingback: dark168
Pingback: betflix allstar
Pingback: lottorich28
Pingback: chat room
Pingback: rondreis gambia senegal
Pingback: JZ-500
Pingback: ทดลองเล่นสล็อต ฟรี
Pingback: บุหรี่นอกราคาถูก
Pingback: kc9
Pingback: เว็บพนันออนไลน์เกาหลี
Pingback: Sbobet777
Pingback: Onlineshop Smart Meter Stromzähler kaufen
Pingback: schuifhordeur
Pingback: 8xbet1 เว็บพนันเว็บตรง อันดับ 1
Pingback: Super Surface
Pingback: kibris escort katalog
Pingback: หวยต่างประเทศ อย่าง ตรวจ หวย ลาว
Pingback: ems89
Pingback: johanna reborn kit
Pingback: OligioX ที่ไหนดี?
Pingback: ไซด์ไลน์
Pingback: relx